Using Tableau Desktop 2018, you can create Visualizations from information stored in your spreadsheets and databases, giving you the ability to quickly perform data analysis with dynamic and great looking Dashboards.
It’s easy to customize your Tableau Visualizations using formatting, annotations, reference lines, trend lines, and forecasts. You can even produce Visualizations with geographic data using Maps. Another feature of Tableau is the ability to create “Stories.” In Tableau, a Story is a sequence of sheets or dashboards which showcase a specific set of insights, and it visually supports how a user came to a specific conclusion.
Putting your visual information all together?? Create a Tableau Dashboard!!
A Dashboard is a selection of views from multiple worksheets which appear on a single tab. After creating your initial worksheets, you’ll appreciate seeing them from a single location. It’s best to complete the desktop Dashboard first — and choosing “Automatic” from the Dashboard Fixed Size option allows the window to resize automatically to display nicely on tablets and smart phones.
 Here’s how to build a Dashboard:
- In the menu, select the Dashboard — New Dashboard.
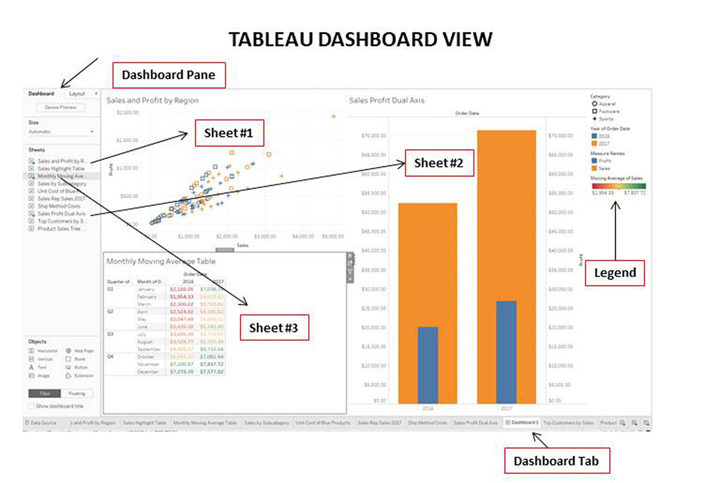
- On the Dashboard 1 tab, in the Dashboard pane, under Size, open the drop-down menu.
- In the Fixed size drop-down menu, select Automatic.
- In the Dashboard pane, under Sheets, select and drag Sheet#1 to the canvas.
- Verify the Sheet#1 Dashboard is visible and includes Legends on the right.
Add additional worksheets to the Dashboard:
- In the Dashboard pane, under Sheets, select and drag Sheet#2 to the canvas and position it until the right half of the canvas is grayed out.
- In the Dashboard pane, under Sheets, select and drag Sheet#3 to the canvas and position it until the bottom left quadrant of the canvas is grayed out.
- Verify your dashboard has three worksheets.
- Hover over some of the marks to see the “Tooltip” information
- Use the Legends to filter the data displayed.
Rename the Dashboard:
- Right-click the Dashboard 1 tab, and select Rename.
- Rename as appropriate and press Enter.
Interested in Dashboards? Come to a Tableau class at Full Circle Computing to learn all about them!!
